
From Wall Street to restaurant kitchens,it is a comprehensive breakdown of average salaries across 20 major industries in New York City, including estimated figures for entry-level, senior-level, and take-home pay.
NYC Industry Salary Overview:
New York City is home to the most economically diverse labor market in the United States. A software engineer in Hudson Yards and a restaurant server in Midtown may work just a few blocks apart, yet they live vastly different financial realities. Understanding what each industry actually pays across the spectrum from entry level to senior roles, rather than relying solely on averages, is essential for workers making decisions about their careers and relocation.
Key context:
In New York City, salaries in almost every sector are higher than the national average, but taxes and expenses are also higher here. On a salary of $120,000 in New York City, you would receive approximately $79,500 (take-home pay) after federal, state, and local tax deductions. Use the calculator below right now to find your specific amount.
Full Industry Salary Table:
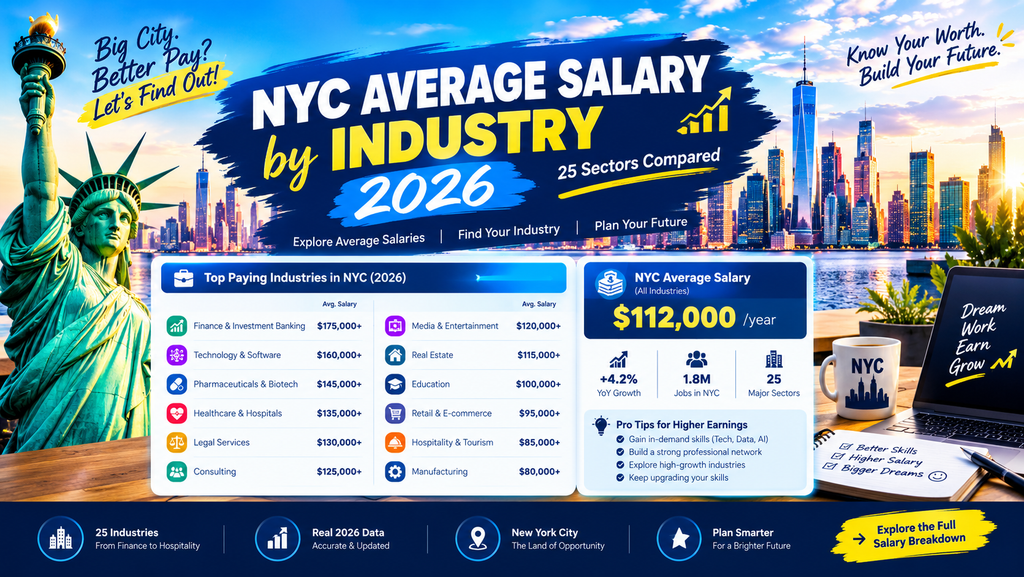
| Industry | Median Annual Salary | Typical Entry | Typical Senior | Est. Take-Home (Single) |
| Finance / Banking | $125,000 | $75,000 | $300,000+ | ~$82,000 |
| Technology / Software | $145,000 | $95,000 | $280,000+ | ~$94,000 |
| Legal Services | $110,000 | $75,000 | $250,000+ | ~$73,000 |
| Architecture / Engineering | $95,000 | $65,000 | $160,000 | ~$64,000 |
| Accounting / Auditing | $90,000 | $60,000 | $175,000 | ~$61,000 |
| Healthcare (RN/NP level) | $95,000 | $72,000 | $135,000 | ~$64,000 |
| Real Estate | $88,000 | $52,000 | $200,000+ | ~$60,000 |
| Media / Entertainment | $72,000 | $45,000 | $140,000 | ~$50,000 |
| Advertising / Marketing | $78,000 | $50,000 | $145,000 | ~$54,000 |
| Higher Education | $82,000 | $55,000 | $145,000 | ~$56,000 |
| Government / Public Admin | $75,000 | $50,000 | $115,000 | ~$52,000 |
| Human Resources | $72,000 | $48,000 | $130,000 | ~$50,000 |
| Construction | $72,000 | $45,000 | $120,000 | ~$50,000 |
| Education (K–12) | $70,000 | $52,000 | $110,000 | ~$49,000 |
| Transportation / Logistics | $62,000 | $40,000 | $95,000 | ~$44,000 |
| Arts / Culture | $58,000 | $36,000 | $100,000 | ~$41,000 |
| Nonprofit / Social Services | $55,000 | $38,000 | $90,000 | ~$39,000 |
| Manufacturing | $52,000 | $36,000 | $85,000 | ~$37,000 |
| Retail Trade | $38,000 | $33,280 | $65,000 | ~$28,500 |
| Food Service / Hospitality | $42,000 | $33,280 | $70,000 | ~$31,000 |
The take-home estimates are for a filer claiming the standard deduction. The figures include the NYC local income tax. Bonuses and equity have been excluded from the calculations.
High-Pay vs. Low-Pay Sectors: What Drives the Gap
There is a massive pay gap between industries in NYC, finance pays nearly three times the median wage of the food service sector. Several structural factors drive this disparity:
Education and Credentialing Requirements:
Educational barriers to entry persist in the highest-paying industries, such as finance, technology, and law. Investment banking analysts typically hold degrees from select universities. Software engineers require either Computer Science degrees or years of self-directed study. Lawyers must pass the bar exam after three years of law school. These credentialing requirements limit the supply of professionals and keep wages high.
Revenue Generation vs. Service Delivery:
In industries where workers directly generate revenue—such as financial advisors, investment bankers, or software engineers who develop revenue-generating products—compensation is far higher than in sectors where wages are viewed merely as a ‘cost center’ (an expense burden). A Wall Street analyst plays a role in a multi-billion-dollar deal, whereas a restaurant waiter contributes to a $40 bill.
Unionization:
Labor unions wield significant influence in New York City, particularly in key sectors such as construction, education, transportation, and healthcare. Thanks to robust collective bargaining agreements, workers in these industries earn substantially higher wages. For instance, a unionized construction worker in New York City earns significantly more for the same work compared to the national average. The healthcare sector is another major stronghold for unions; the ‘1199SEIU’ union alone represents over 200,000 healthcare workers across the metropolitan area.
Geographic Distribution Within NYC:
Industries are concentrated in specific parts of the city, which impacts both wage levels and issues related to transportation:
Finance:
Lower Manhattan (Wall Street, Financial District), Midtown (Rockefeller Center area)
Technology:
Midtown South (Flatiron, Chelsea), Hudson Yards, DUMBO (Brooklyn), Midtown East
Media/Advertising:
Midtown (Times Square area), Chelsea, Hudson Square
Healthcare:
Distributed citywide; major clusters in Midtown East (Weill Cornell), Washington Heights (NewYork-Presbyterian), Upper East Side
Legal:
Midtown (Park Ave corridor), Financial District
Education:
Distributed across all five boroughs
Hospitality/Retail:
Midtown, Lower Manhattan, outer-borough commercial corridors
Industry Wage Growth Trends:
In 2026, not all industries are growing at the same rate. The post-COVID labor market has reshuffled the sectors experiencing the highest wage growth:
Fastest Wage Growth (2024–2026):
Healthcare:
Salaries for Registered Nurses (RNs) have risen by 8 to 12 percent since 2022 due to factors such as the nursing shortage, a significant post-pandemic surge in demand, and expanded Medicaid reimbursement rates.
Finance:
A resurgence in Mergers and Acquisitions (M&A) activity and IPOs in 2025 has pushed Wall Street bonus pools back to levels last seen around 2021.
Construction:
Wages in the construction sector in New York City are gradually rising due to infrastructure spending and a persistent shortage of residential housing.
Slower or Stagnant Growth:
Technology:
After a rapid rise in salaries during 2021–2022, tech sector salaries in New York City (NYC) stabilized during 2023–2024 following widespread industry layoffs. Although base salaries remain high, total compensation (including RSUs) for mid-level engineers has declined.
Nonprofit/Social Services:
Persistently inadequate funding means that wages have barely kept pace with inflation.
Media/Publishing:
Structural decline in the industry has suppressed wages and reduced the size of the workforce.
Salary Variation Within NYC Industries:
| Industry | Example Role | Lower/Typical Pay | Higher Pay | Why the Gap Exists |
| Technology | Software Engineer | ~$90,000–$130,000 | $200,000–$300,000+ | Company size, experience, bonuses, and equity |
| Legal Services | Public Defender | ~$75,000 | $225,000+ | Employer type, law firm size, experience, and specialization |
| Finance | Financial Analyst | ~$75,000–$100,000 | $150,000–$250,000+ | Bonuses, firm type, role, and experience |
| Healthcare | Registered Nurse | ~$75,000–$100,000 | $120,000–$150,000+ | Specialty, shift differentials, experience, and employer |
| Engineering | Entry-Level Engineer | ~$65,000–$80,000 | $130,000–$160,000+ | Engineering discipline, experience, and employer |
| Marketing | Marketing Specialist | ~$50,000–$70,000 | $120,000–$150,000+ | Seniority, industry, company size, and performance |
| Construction | Construction Worker | ~$45,000–$65,000 | $100,000–$150,000+ | Union status, trade, overtime, and experience |
| Hospitality | Restaurant Worker | ~$33,000–$45,000 | $60,000–$80,000+ | Tips, location, employer, and position |
What NYC Industry Data Doesn’t Show:
Median salary figures mask significant disparities within industries. For instance, a software engineer at a FAANG company (major tech firms) earns two to three times as much as an engineer at a mid-sized startup, even though both belong to the same “technology” category. Similarly, a first-year lawyer at a major law firm (“BigLaw”) earns $225,000, whereas a public defender earns $75,000—yet both operate within the “legal services” sector.